
MODE:
The number which appears most frequently in the series then it is said to be the mode of n numbers.
Mode of Grouped Data:
In the un grouped data the most frequently occurring no. is the mode of the sequence, but in the grouped data we can find the class interval only which has the maximum frequency number i.e. the modal class.
The value of mode in that modal class is calculated by
Mode = l + ( \frac{ f_{1} - f_{0} }{2 f_{1} - f_{0} - f_{2} } ) × h
l = lower class limit of the modal class A1,
h = class interval size
f1 =frequency of the modal class
f0 =frequency of the preceding class
f2= frequency of the succeeding class
Example : The table of the marks of the students of a class is given. Find the modal class and the mode.
Solution: Here we can see that the class interval with the highest frequency 8 is 20 – 40.
So this is our modal class.
Modal class = 20 – 40
Lower limit of modal class (l) = 20
Class interval size (h) = 20
Frequency of the modal class(f1) = 8
Frequency of the preceding class(f0) = 4
Frequency of the succeeding class (f2) = 6
Mode = l + (f1 −f0)/(2f1−f0−f2 ) ×h
= 20 + [(8− 4)/(16 − 4 − 6)]×20
= 20 + 4/6 × 20
= 20 + 13.33
= 33.33
EXERCISE 14.2
1.The following table shows the ages of the patients admitted in a hospital during a year:
Find the mode and the mean of the data given above. Compare and interpret the two
measures of central tendency.
Solution To find out the modal class, let us the consider the class interval with high frequency
Here, the greatest frequency = 23, so the modal class = 35 – 45,
l = 35 and class width (h) = 10,
f1 = 23,
f0 = 21 and
f2= 14
The formula to find the mode is
Mode = l + (f1 − f0)/(2f1 − f0 − f2 ) × h
Substitute the values in the formula, we get
= 35 + (23− 21)/(46 − 21 − 14) × 10
= 35 + 20/11
= 35 + 1.8
Mode = 36.8 year
So the mode of the given data = 36.8 year
Calculation of Mean:
First find the midpoint using the formula, Midpoint xi = (Upper Limit+Lower Limit)/2
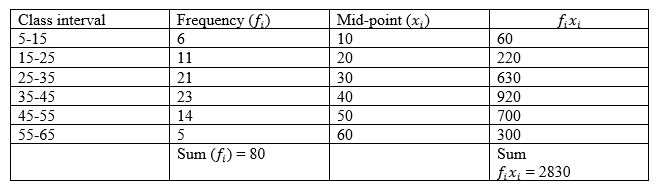
The mean formula is
Mean = x̄ = (∑f1 x1 )/(∑f1 )
= 2830/ 80
= 35.37 years
Therefore, the mean of the given data = 35.37 years
2.The following data gives the information on the observed lifetimes (in hours) of 225
electrical components:
Determine the modal lifetimes of the components.
Solution From the given data the modal class is 60–80.
l = 60,
The frequencies are:
f1 = 61,
f0 = 52 and
f2= 38
The formula to find the mode is
Mode = l + (f1 − f0)/(2f1 − f0 − f2 ) × h
Substitute the values in the formula, we get
= 60 + (61 − 52)/(122− 52 − 38) × 20
= 60 + 45/8
Mode = 60 + 5.625
Therefore, modal lifetime of the components = 65.625 hours.
3.The following data gives the distribution of total monthly household expenditure of 200
families of a village. Find the modal monthly expenditure of the families. Also, find the
mean monthly expenditure:
Solution: Given data:
Modal class = 1500-2000, l = 1500,
Frequencies: f1 = 40, f0 = 24 and
f2= 33 h = 500
The formula to find the mode is
Mode = l + (f1 − f0)/(2f1 − f0 − f2 ) ×h
Substitute the values in the formula, we get
= 1500 + (40 − 24)/(80 − 24 − 33) × 500
= 1500 + 8000/23
Mode = 1500 + 347.83
Therefore, modal monthly expenditure of the families = Rupees 1847.83
Calculation for mean:
First find the midpoint using the formula, xi = (Upper Limit+Lower Limit)/2
Let us assume a mean, A be 2750
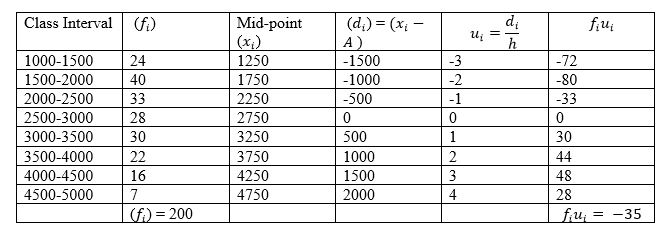
The formula to calculate the mean,
Mean = x̄ = A + h (∑fi ui )/(∑fi )
Substitute the values in the given formula
= 2750 + [500 x (−35)]/200
= 2750 − 87.50
= 2662.50 So, the mean monthly expenditure of the families = Rupees 2662.50
4. The following distribution gives the state-wise teacher-student ratio in higher secondary schools of India. Find the mode and mean of this data. Interpret the two measures
Solution Given data:
Modal class = 30 – 35,
l = 30 and Class width (h) = 5,
f1 = 10,
f0 = 9 and
f2= 3
The formula to find the mode is
Mode = l + (f1 − f0)/(2f1 − f0 − f2 ) ×h
Substitute the values in the formula, we get
= 30 + (10− 9)/(20 − 9 −3) × 5
= 30 + (1/8) x 5
= 30 + 5/8
Mode = 30 + 0.625
Mode = 30.625
Therefore, the mode of the given data = 30.625
Calculation of mean:
Find the midpoint using the formula, xi = (Upper Limit+Lower Limit)/2
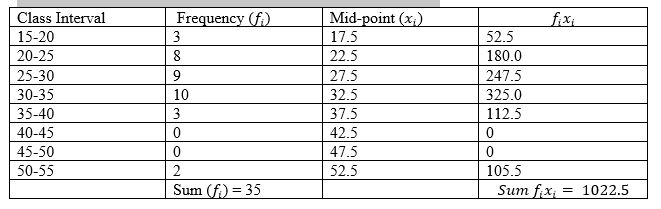
Mean = x̄ = (∑fi xi )/(∑f_i )
= 1022.5/35
= 29.2
Therefore, mean = 29.2
5.The given distribution shows the number of runs scored by some top batsmen of the world in one- day international cricket matches.
Find the mode of the data.
Solution Given data:
Modal class = 4000 – 5000,
l = 4000, and class width (h) = 1000,
f1 = 18
f0 = 4 and
f2= 9
The formula to find the mode is
Mode = l + (f1 − f0)/(2f1 − f0 − f2 ) ×h
Substitute the values in the formula, we get
= 4000 + (18− 4)/(36 − 4 − 9) ×1000
= 35 + 14000/23
Mode = 4000 + 608.695
Mode = 4608.695
Mode = 4608.7 (approximately)
Thus, the mode of the given data is 4608.7 runs
6.A student noted the number of cars passing through a spot on a road for 100 periods each of 3 minutes and summarized it in the table given below. Find the mode of the data:
Solution Given Data:
Modal class = 40 – 50, l = 40,
Class width (h) = 10,
f1 = 20,
f0 = 12 and
f2= 11
The formula to find the mode is
Mode = l + (f1 − f0)/(2f1 − f0 − f2 ) ×h
Substitute the values in the formula, we get
= 40 + (20 − 12)/(40 − 12 − 11) ×10
= 35 + 80/17
Mode = 40 + 4.7 = 44.7
Thus, the mode of the given data is 44.7 cars.